Where Baku Actually Borrows: Mortgage Demand by District
Published on 2026-10-11 · 8 min read
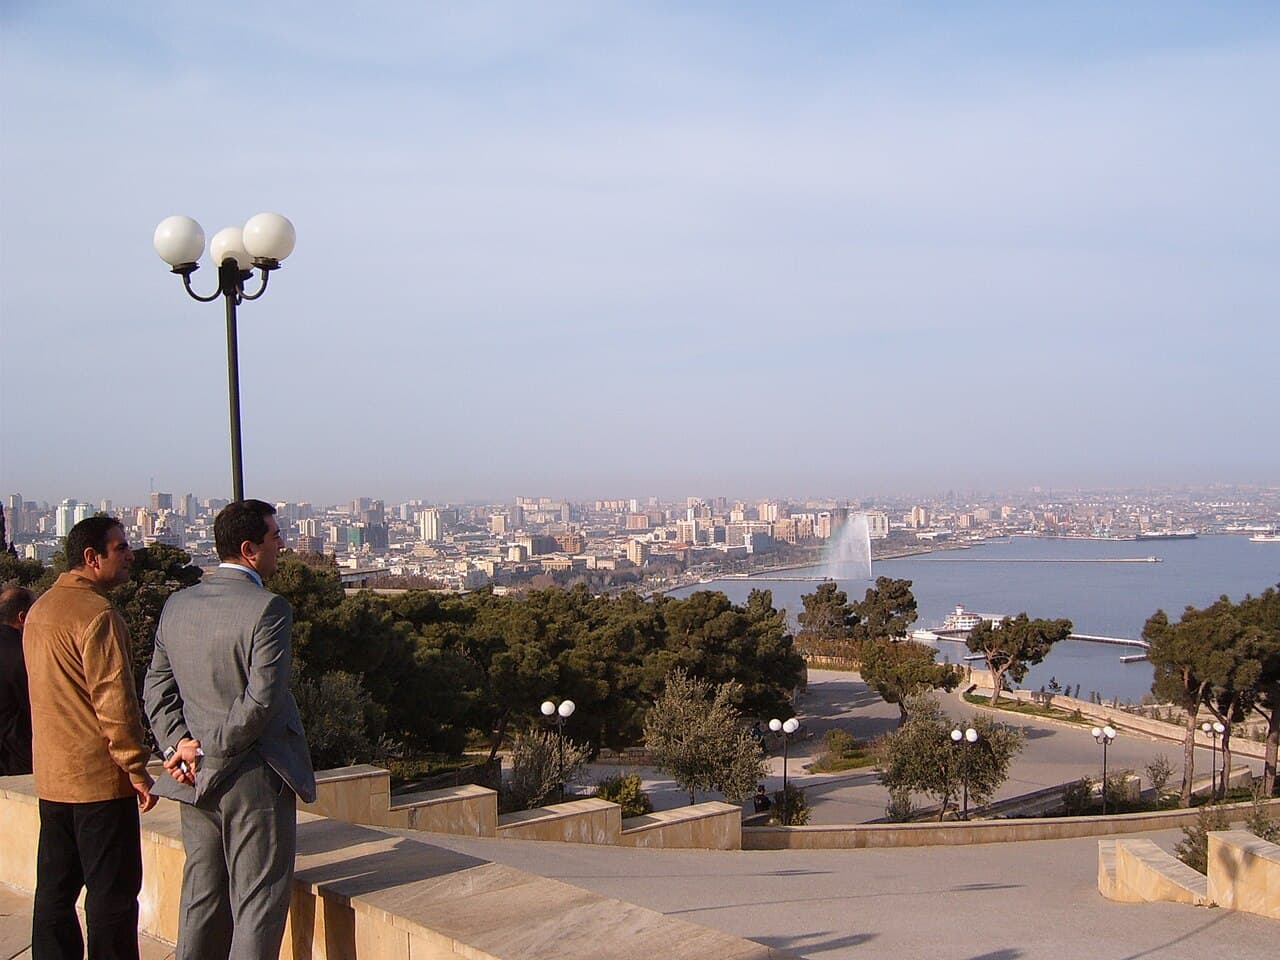
As at 30 June 2026, the Mortgage and Credit Guarantee Fund of Azerbaijan had 59,082 mortgage loans on its books nationally, of which 45,607 - 77.2% - are in Baku. Inside Baku the distribution is not where the marketing points: Xətai district holds 10,063 loans and Səbail, the seafront, holds 1,490. That is a 6.8-fold difference between the district that borrows most and the most expensive address in the city.
We pulled and cross-checked these figures ourselves from the Fund's published infographics. The methodology and the limits are at the bottom of the page.
Mortgage loans by Baku administrative district
| District | Loans | Share of Baku |
|---|---|---|
| Xətai | 10,063 | 22.1% |
| Yasamal | 8,880 | 19.5% |
| Binəqədi | 5,851 | 12.8% |
| Suraxanı | 5,256 | 11.5% |
| Nizami | 3,456 | 7.6% |
| Nəsimi | 3,428 | 7.5% |
| Nərimanov | 3,264 | 7.2% |
| Sabunçu | 2,034 | 4.5% |
| Səbail | 1,490 | 3.3% |
| Qaradağ | 947 | 2.1% |
| Xəzər | 889 | 1.9% |
| Pirallahı | 49 | 0.1% |
| Baku total | 45,607 | 100% |
What the Xətai-Səbail gap actually tells you
Two districts, 22.1% against 3.3%. The obvious reading - that Xətai is more popular - is the wrong one. What this measures is credit-financed demand, and credit-financed demand is a mid-market phenomenon everywhere. Səbail is not short of buyers; it is short of buyers who need a mortgage. The seafront is substantially a cash market, and the mid-market districts are where the banking system is actually underwriting households.
For an investor that reframes two things. First, resale liquidity in Xətai and Yasamal is underpinned by a financing channel that barely touches Səbail - 41.6% of all Baku mortgages sit in those two districts alone. Second, a price-per-square-metre table flattens exactly this distinction. Two districts can show similar prices and have completely different buyer mechanics behind them.
How much deposit buyers really put down
This is the question every entry-level guide answers with a guess. The Fund publishes the actual loan-to-value distribution across all 59,082 loans:
| LTV band | Loans | Share | Implied deposit |
|---|---|---|---|
| 0-50% | 5,398 | 9.1% | 50%+ |
| 51-60% | 6,190 | 10.5% | 40-49% |
| 61-70% | 17,670 | 29.9% | 30-39% |
| 71-80% | 17,287 | 29.3% | 20-29% |
| 81-90% | 12,537 | 21.2% | 10-19% |
78.8% of borrowers put down 20% or more. Only 21.2% of loans exceed 80% LTV. The modal borrower sits in the 61-80% band - a deposit of 20 to 39 per cent.
Mortgage & Financing Calculator
Estimate a monthly payment for a property purchase in Azerbaijan based on the property price, down payment, interest rate, and loan term you enter.
Results
- Loan amount
- $150,000
- Estimated monthly payment
- $1,612
- Total interest over the term
- $140,143
- Total cost (principal + interest)
- $290,143
Private-sector interest rates in Azerbaijan in 2026 generally ranged around 8%-14% (varies by bank and credit history), with a typical down payment of 20%-30%. Subsidized state mortgage programs are not available to foreign buyers, who rely on private bank financing or cash purchases.
What the market actually finances: 41 to 80 m²
| Floor area | Loans | Share |
|---|---|---|
| under 41 m² | 3,438 | 5.8% |
| 41-60 m² | 18,771 | 31.8% |
| 61-80 m² | 17,632 | 29.8% |
| 81-100 m² | 9,290 | 15.7% |
| 101-120 m² | 4,361 | 7.4% |
| over 120 m² | 5,590 | 9.5% |
61.6% of all mortgaged property is between 41 and 80 m². Anything over 100 m² is 16.8% of the book. If you are buying for resale rather than for yourself, that distribution is the shape of your future buyer pool - and a 130 m² apartment is competing for the attention of one sixth of the financed market.
Affordability stress: 42.9% pay over 30% of income
| Annuity as share of monthly income | Loans | Share |
|---|---|---|
| 0-10% | 3,303 | 6.2% |
| 11-20% | 15,120 | 28.3% |
| 21-30% | 12,127 | 22.7% |
| 31-40% | 12,127 | 22.7% |
| 41-50% | 6,683 | 12.5% |
| 51-60% | 2,966 | 5.5% |
| 61-70% | 1,103 | 2.1% |
| over 70% | 52 | 0.1% |
42.9% of borrowers pay more than 30% of monthly income on the annuity, and 20.2% pay more than 40%. This is the constraint on how much further local demand can push prices without wage growth, and it is worth reading next to the price trend: per the State Statistical Committee, the primary market rose 12.38% year on year in Q2 2026 against 8.58% for the secondary market.
The part that applies to a foreign buyer - and the part that does not
You cannot use these programmes. The Fund's subsidised and standard mortgage lines are for local borrowers; a foreign buyer is looking at private bank lending on different terms, or at cash. We cover what that looks like in the guide to mortgage rates and the lending market, and the ownership rules in the guide for foreign buyers.
So why does this data matter to you? Because it is the shape of the demand you are buying into. The district distribution tells you where households with financing are concentrated, the area distribution tells you which product has the deepest resale pool, and the PTI distribution tells you how much headroom local demand has left. None of that is visible in a price-per-square-metre average.
The other half: how many deals actually registered
MCGF shows the stock of credit. The State Service on Property Issues publishes the flow of transactions — and in 2025 the two moved in opposite directions.
National state registrations of property rights, 2025 against 2024:
| 2024 | 2025 | change | |
|---|---|---|---|
| All registrations | 378,495 | 364,136 | −3.8% |
| of which first registration | 64,454 | 70,596 | +9.5% |
| of which repeat registration | 314,041 | 293,540 | −6.5% |
| Apartments, first | 24,994 | 27,690 | +10.8% |
| Apartments, repeat | 60,944 | 65,198 | +7.0% |
| Houses and dachas, first | 21,429 | 26,348 | +23.0% |
| Houses and dachas, repeat | 41,577 | 45,340 | +9.1% |
| Land, first | 13,658 | 12,056 | −11.7% |
| Land, repeat | 202,925 | 174,539 | −14.0% |
| Mortgage registrations | 73,809 | 63,836 | −13.5% |
The headline figure is misleading and the detail matters. Registrations fell 3.8% overall, which reads like a cooling market. It is not a housing story. Repeat land registrations alone fell by 28,386 — nearly twice the entire net decline of 14,359 — and land is 48% of all registrations, so it dominates the total. Strip it out and housing grew: apartments up 8.1% across both registration types, houses and dachas up more.
The figure worth sitting with is the mortgage line. Registered mortgages fell 13.5% in a year when apartment transactions rose 8.1%. More housing deals, fewer of them financed. That is the same pattern the district table above shows at city scale — credit concentrated in the mid-market while the expensive districts transact in cash — appearing again at national scale.
One limit, stated plainly: mortgage registrations cover every property type, not apartments alone, so "more apartment deals done in cash" is a reasonable reading but not something this data proves on its own. What it does establish is that transaction volume and credit volume diverged.
Source: State Service on Property Issues of the Republic of Azerbaijan,
emlak.gov.az/az/page/view/22, registration statistics, annual series, retrieved
11 October 2026. Granularity is annual and national, broken down by property type
and by first versus repeat registration. There is no monthly series and no
breakdown by Baku district — we checked, because that would have been the more
useful dataset. Note also that the price figures elsewhere on this page are Q2
2026 against Q2 2025, while these volumes are full-year 2025 against 2024; the
periods are adjacent, not identical, and should not be read as one series.
Methodology and limits
- Source: Mortgage and Credit Guarantee Fund of Azerbaijan, published infographics,
mcgf.gov.az/az/infoqrafikler. All series dated 30.06.2026. Retrieved and parsed 11 October 2026. - Cross-check: the district figures sum to 45,607, which matches the Fund's own regional dataset independently. The national total of 59,082 appears consistently across the LTV, floor-area and borrower-income series.
- Known limit: the PTI series totals 53,481 rather than 59,082, so roughly 5,600 loans have no PTI figure recorded. The PTI percentages above are shares of the 53,481 that do. We have not adjusted for this and do not know the reason.
- Known limit: the Fund's portfolio value series is labelled "mln manat" while its band labels are in manat. Because that unit is ambiguous in the source, we have left it out rather than guess.
- Scope: these are loans through the Fund. Private bank mortgages outside the Fund's channel are not included, so this is a large sample of the subsidised and guaranteed market, not the whole credit market.
- Price trend context: State Statistical Committee of Azerbaijan, residential property price indices, series 007_1, data through Q2 2026.
This page is informational and is not investment, tax or legal advice. The figures are accurate as at the measurement dates stated above.
 Real estate investing
The State of Baku's Villa and Private-House Market
How the villa and private-house segment in Baku and its suburbs differs structurally from the apartment market, and who is actually buying
Read more →Real estate investingBaku vs Almaty and Tashkent: Central Asian Markets
Comparing property investment in Baku with Almaty in Kazakhstan and Tashkent in Uzbekistan — accessibility, liquidity, currency risk, regulation and yield potential
Read more → Real estate investing
Baku vs Cyprus and Greece: Where to Invest
Comparing property investment in Baku with Cyprus and Greece — entry prices, golden visas, European taxation, yields and seasonality. Which suits which investor
Read more →